OfficeGraph
Integrating with Facebook's GraphQL to deliver deeply-meshed office data to the surface.
Integrating with Facebook's GraphQL to deliver deeply-meshed office data to the surface.
The Innovation Team here at ICF Olson has been exploring the possibilities set forth by Facebook’s GraphQL technology, which was made available to the public back in 2015. GraphQL is a data querying language that allows the client to choose how the server response is shaped. By sending queries to your API, the client is no longer restricted to a JSON response shape that is decided by the server. This gives a client the ability to query all the data it needs in a single request rather than sending requests to multiple URLs based off of some resource identifier or set of resource identifiers returned in the first response, as one might find in a traditional REST API.
To put things into perspective, let’s say you’re building an app for your office (which we are doing) that displays data for all sorts of things within your office. These could be physical things such as coffee makers connected to an IoT device or intangible things such as upcoming projects and who is assigned to those projects. Using a traditional REST API to represent people in a particular office and their assigned projects, you might have resource URIs that look like the following:
GET /offices/1/people
{
  "people": [
    {
      "id": 1001,
      "name": "Eric Van Geem",
      "role": "Developer",
      "projects": [
        "/projects/105"
      ]
    },
    {
      "id": 1002,
      "name": "John Smith",
      "role": "Designer",
      "projects": [
        "/projects/105",
        "/projects/107"
      ]
    }
  ]
}
This endpoint returns a list of people in a particular office. Within each person object you have a list of assignment IDs representing projects the person is currently assigned to. You can’t display anything useful yet with just the IDs of those projects, you must fetch the project data from yet another set of resource URIs to get the project names, start and end dates, etc.
GET /projects/105
{
  "id": 105,
  "name": "Site re-design",
  "client": "ICF Olson",
  "start": "2017-02-28",
  "end": "2017-03-30",
  "people": [
    "/people/1001",
    "/people/1002",
    "/people/1006"
  ]
}
GET /projects/107
{
  "id": 107,
  "name": "The next best app",
  "client": "CITYTECH, Inc.",
  "start": "2017-01-15",
  "end": "2017-06-23",
  "people": [
    "/people/1002",
    "/people/1043"
  ]
}
This returns us yet another set of URLs to fetch in order to get more complete data.
So how does GraphQL help with this?
Instead of returning references to objects via IDs and new endpoints, a GraphQL enabled server would allow the client to query for the actual nested object instead. Sure, you could certainly do this with a regular REST API as well, but the difference is that GraphQL allows you query specific fields on those nested objects so that the entire object is not included in the response, only the fields on that object you actually care about.
If I wanted to get a list of people’s names and their roles for a particular project, I can query the GraphQL server to return to me just the list of names and roles of those people instead of forcefully being fed a list of entire people objects to parse and filter through. Here is a sample GraphQL query and the resulting server response:
{
  projects(id:105) {
    name
    start
    end
    people {
      name
      role
    }
  }
}
{
  "data": {
    "projects": [
      {
        "name": "Site re-design",
        "start": "2017-02-28",
        "end": "2017-03-30",
        "people": [
          {
            "name": "Eric Van Geem",
            "role": "Developer"
          },
          {
            "name": "John Smith",
            "role": "Designer"
          },
          {
            "name": "Joe Whiskey",
            "role": "Project Manager"
          }
        ]
      }
    ]
  }
}
The first code snippet is our GraphQL query, which almost looks like a JSON structured document. While the query itself is not actual JSON, it represents the shape of the JSON response we are expecting from the server. Looking at the response in the second snippet, the GraphQL server gave us the exact data we asked for and nothing extra that we do not need. This means smaller responses, which also means faster responses to our mobile apps which are susceptible to slow internet speeds at times.
GraphQL uses a type system to describe what queries can be understood and validated against. A server defines a schema, which is essentially an object definition comprised of several fields and can contain further nested objects within it. Every field in a schema type has an associated resolver function that you may provide in your GraphQL server and is invoked by the library whenever that particular field is queried. The resolver function defines how that particular field is fetched and returned in the query results.
GraphQL really started to appeal to us when we realized we can have very modular schemas where each schema and chunks of each schema can be pulled in from many of our disparate systems. This allows us to build all sorts of different systems which can serve their own purposes yet still have data exposed in a common graph.
GraphQL supports a wide variety of different programming languages to choose from. In our case, we naturally went with the Node.js variant since Facebook has already provided a nice middleware module to plug into express.js. This middleware can be found on NPM under the name express-graphql. There are other server implementations out there provided by third parties, but for ease of use and simplicity, we went with Facebook’s implementation for now.
After we were quickly up and running with our express server, we were able to start hooking up to various systems to fetch our office data from. A few of these systems include:
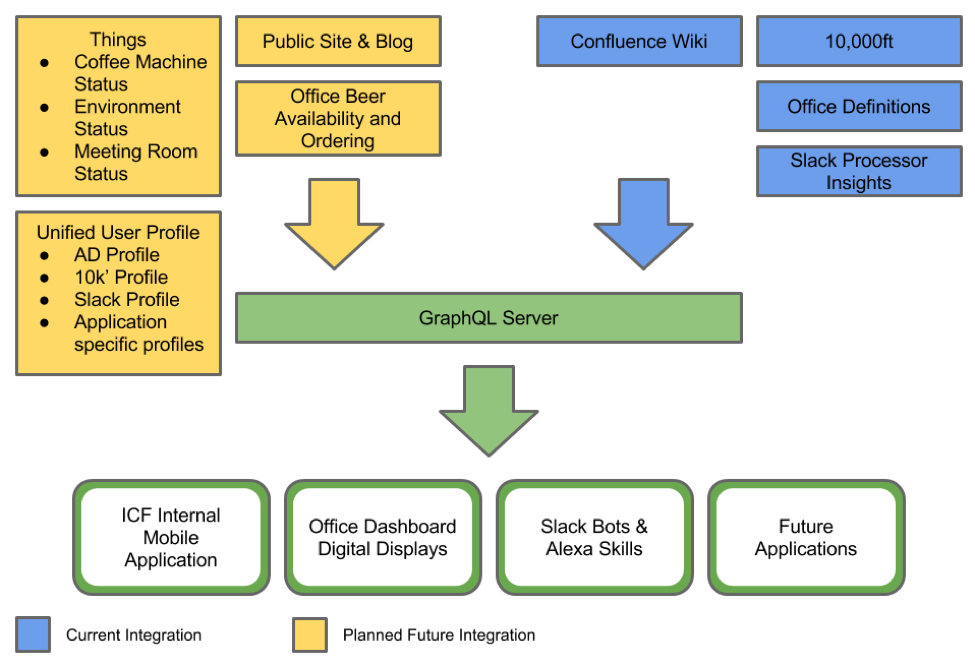
When I mention AWS, I am actually referring to a number of data sources that we are directing into the platform that gets stored inside AWS’s DynamoDB which our GraphQL service is reading from. Some of these data sources include an IoT device we’ve built to monitor real time usage of the coffee machines in our offices, and another being our Slack processor used for parsing and reading popular (“hot”) topics that are discussed within our internal Slack team (See Spying on the Office).
10,000ft. is a resource planning tool which gives us access to employee and project data, letting us see what projects are in the pipeline and who is assigned to them. The people and projects example shown above is just a small example of what we’re actually doing with the 10,000ft. API. Using this API, we can easily expose things like what future assignments an employee is slated for, upcoming vacation days of anyone for a particular project, groupings of roles by area of business, and much more.
We use a Confluence Wiki for all of our internal wiki posts throughout the organization. Conveniently enough, Confluence provides a pretty straightforward API which we are using to provide data in our graph. The latest wiki posts, along with who posted them and who commented on them, provides a graph consumer plenty of insight as to what is going within the company.
As far as authentication, tooling, and hosting goes, we currently have our GraphQL server hosted on AWS Elastic Beanstalk which is automatically deployed by AWS CodePipeline any time there is a push to the application’s GitHub repository. Authentication to our GraphQL server is handled via Azure Active Directory with JSON Web Tokens. An employee using our Office Portal app (details on that to follow in a later blog post) will log in with their email and password to prove they are actually an employee with us, and will receive a JWT from Azure which is then attached to all requests to our GraphQL server.
The key point we’ve realized with building a graph is that this is an ever-evolving system that does not require a complete solution planned out in advance. If you make some strategic design choices along the way, you can continuously build up all of these capabilities which become cohesive over time. As our team progressively builds more innovative products with the latest technology trends, we will continue to add new schemas of data to our graph as it becomes available.